5 reasons why OpsBridge is better than cloud vendor monitoring
One of the common questions we get is, “Why should I use Operations Bridge (OpsBridge) for cloud monitoring if I’m only using one cloud vendor?”
It’s true, Cloud vendors such as AWS and Azure offer monitoring services. But look a little deeper to see the differences. Using AWS CloudWatch as an example, you can get hundreds of metrics and events. They do cover what a basic solution covered a decade ago.
What does OpsBridge provide beyond these basics? It gives deep monitoring, event management – correlation and noise reduction, consolidation of events and metrics for cloud and on-premises (including multiple clouds), and automated remediation of problems.
Deep monitoring
The most implemented service in clouds is Infrastructure-as-a-Service (IaaS). The most typical deployment is running traditional workloads (Apache, JBOSS, SQL, etc.) as-is but on a cloud VM. The Cloud vendor can tell you about the VM system, the network, storage, etc. but not what’s happening inside the VM. A common environment is a LAMP (Linux, Apache, MySQL, and PHP) stack. If MySQL is causing your app issues, Cloud vendor monitoring will not be helpful. This is where Operations Bridge provides deep-dive monitoring of Cloud VMs wherein you get the visibility of monitoring parameters beyond what a cloud vendor API gives you. Operations Bridge also provides service awareness context in monitoring the IaaS cloud deployment, which helps you analyze the problem’s impact.
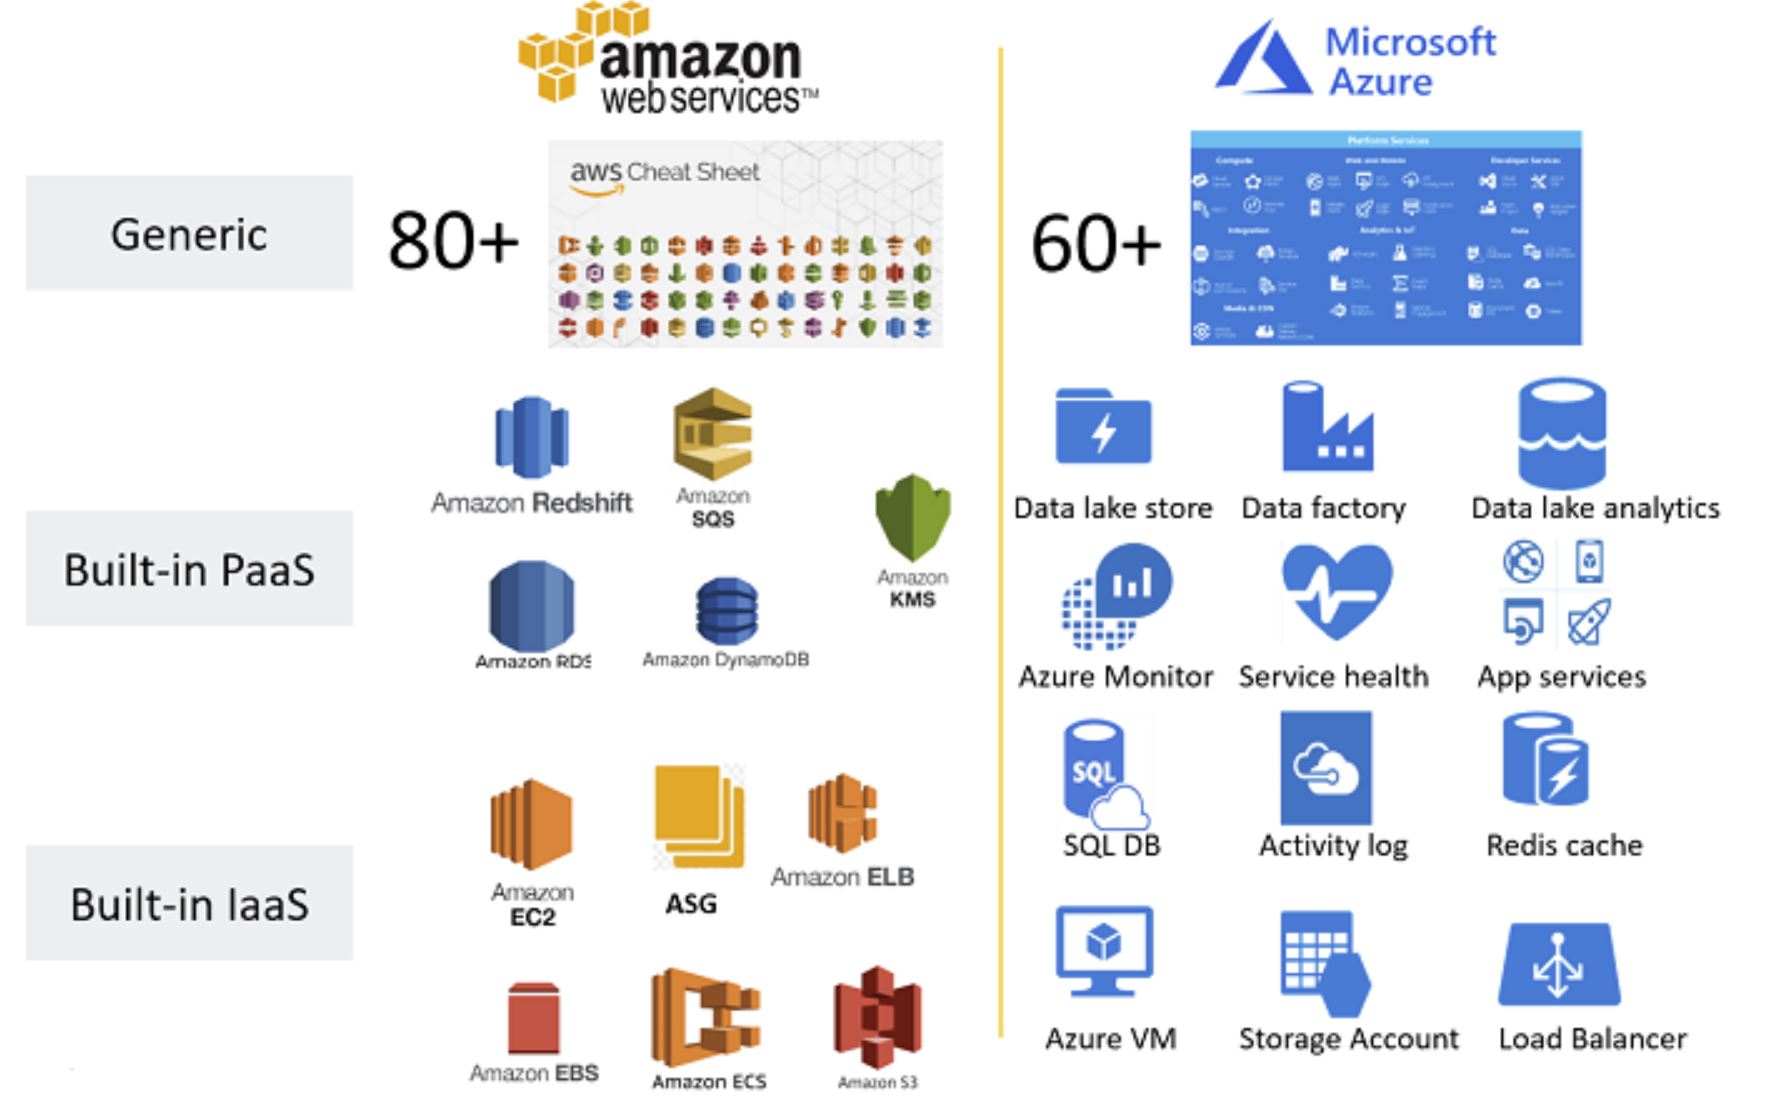
OpsBridge also monitors 80 AWS services and 60 Azure services via APIs. OpsBridge also supports you at any step of your cloud journey – 1) Lift-n-shift IaaS, 2) Cloud PaaS adoption, 3) Cloud-native applications
Cloud and the data center
While many customers have a single application in a single cloud, I don’t know of many customers who don’t have a data center. Most of our users want their enterprise monitoring and operations team to monitor everything, preferably within a single console. Why? Go back to my point about service-centric monitoring. You want the operations team to focus on the most critical applications.
User experience monitoring
Most analysts now say organizations need to do user experience monitoring as cloud monitoring without an application or an end-user context isn’t of that great a value. OpsBridge has two tools, Business Process Monitor (BPM), which uses synthetic monitoring. And Real User Monitor (RUM), which monitors real user traffic on the network. This gives you the capability to monitor both tops down, application into infrastructure, and bottoms up, infrastructure to application. BPM helps you with synthetic transaction monitoring of cloud-based applications, including SaaS, and helps measure user experience from multiple locations.
Consolidation, correlation, and noise reduction
Event consolidation concepts are over 20 years old. Consolidating events means bringing events from multiple tools into a single console, removing the need to move between tools to get a full picture. Since then, there have been significant advances.
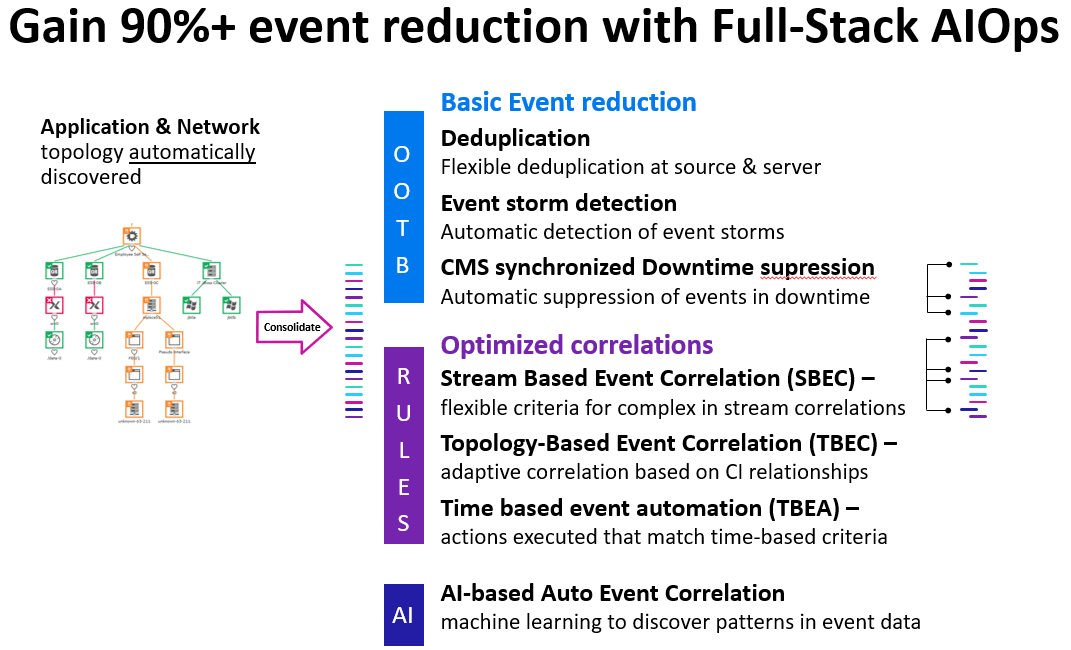
OpsBridge brings another type of consolidation – topology consolidation. This is the ability to show an end-to-end service topology no matter where service elements live – in cloud 1, cloud 2, or on-premises – see the upper right of Figure 2.
Event correlation and noise reduction are the most often cited reasons folks use OpsBridge. We’ve been doing it for a long time, and we’ve learned a lot over that time.
Getting hundreds or thousands of events per day is more than most operations teams can efficiently handle. That’s how the concept of event correlation came about.
Let’s take an example of a retail shopping application on the web. It will consist of a load balancer, web server, application server, database, and the network connecting them. Imagine the database disk gets full. You might get the following events; a disk is full error from the disk subsystem, database error, application server database unresponsive. That’s three errors, but only one is the root cause. Further, consider you might have a thousand or more applications, and other applications might be having problems and sending events.
Two problems are exposed. First, how long (or how many experts) does it take to figure out the root cause. Second, which application is the most important to fix? If one application is a revenue-generating and the other isn’t, we know to fix the revenue-generating first. But if we don’t know which database is connected to which application, the operator has to guess.
Enter service-aware event correlation. For any given set of events, you’d like to have the probable root cause. In figure 2, we see the various event reduction techniques OpsBridge can perform. Some customers have seen as much as a 90% event reduction.
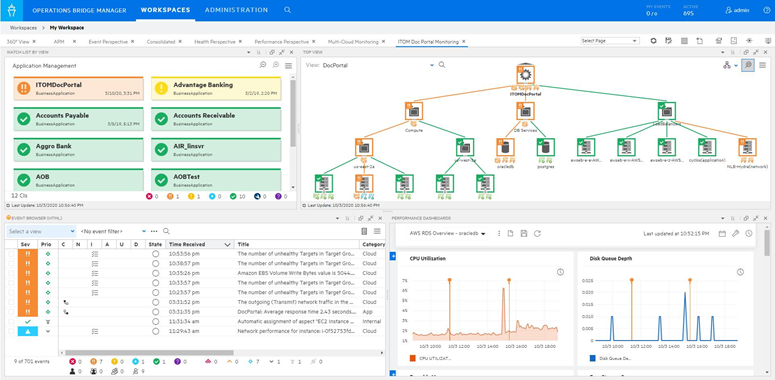
The second part I mentioned is service awareness. Service awareness comes by building a topology, as shown in the upper right of figure 3. On the far upper left, you can see eight applications. By selecting one of them, just to the right of that, you see resources such as AWS EC2, RDS, and ELB services that comprise the application.
On the lower left, you see events filtered by the application or resource you select. The two events are correlated, indicated by the icons in the column labeled “C”. If you were to click on those events, they would expand so you can see the symptom events.
Automated remediation
After finding the problem, we need to fix it. Cloud vendors don’t provide automated remediation. OpsBridge comes with thousands of workflows and operations. These can be operator triggered or set up to automatically run once connected to an event profile. One customer has fully automated problem resolution with 95% of action taken without human intervention.
OpsBridge uses management packs to package discovery, monitoring, and visualization for various domains. If you’d like more technical information, check out the blog post – Hybrid Cloud Management with OBM Management Packs
While Cloud vendors provide basic monitoring, like hardware vendors element managers from the past, the state of IT infrastructure and application monitoring has progressed a long way since then. Monitoring, giving actionable advice, showing the business impact, and automating remediation are where OpsBridge shines.
By Tapan Shah, Product Manager, Operations Bridge, and Michael Procopio, Product Marketing Manager, Operations Bridge at MicroFocus